Sometimes you get so involved in one kind of analysis that you just forget others, committing one of the most common mistakes: lack of attention. This is particularly bad when the set of tools you use is limited to a couple, and very efficient. Last week I was so involved with my date projections that I overlooked other aspects of my analysis, to the point that one reader – bullnbear87 – had to call my attention to it. Yesterday, my post was all about the absence of any sign of a nearing – or even behind – bottom. And today we saw the market tanking to unbelievable levels. First, I’m going to show where we are, and this is historical. Then I’m going to show my big bold unforgivable mistake. First, VIX:
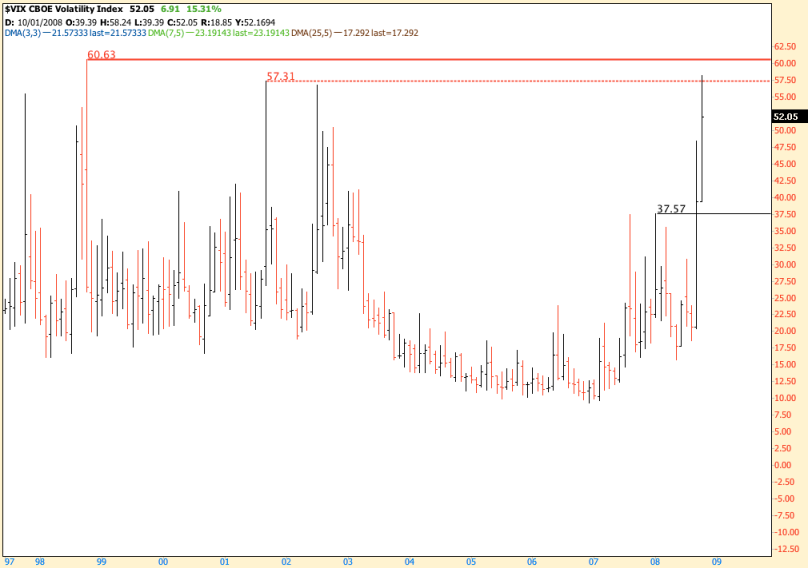
Notice that this is a 10 year monthly chart. Today we peaked above 2001’s high, to levels unseen since 1998. Notice also that today’s close is the highest in the chart.
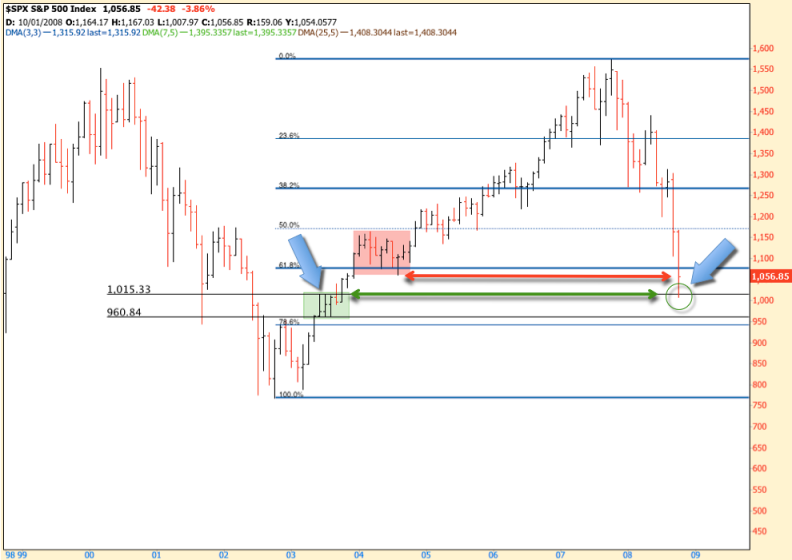
SPY seems to be oversold, reaching a level not seen since 2000. Are we up for a bounce? Maybe. Check this out:
Today SPX just stormed through the bottom level of the consolidation zone marked with a red rectangle and kissed the top of the next important consolidation zone marked in green. Notice however that today’s close is exactly the bottom of the red rectangle. More or less two weeks ago I talked about a target of SPX 920. At that time SPX was trading around 1200, so 920 was like science-fiction. Today we are not very far from it. However, I would still look for a better entry point. Financials are also going where they are supposed to go (not to hell, but not very far from it):
I mean, they are going below July’s low. As weird as it can be, there’s a huge divergence on the MACD and DPO. But, as many here already know, I don’t trade based on divergences. What I see instead, is more room to fall.
Now, here is the big bold unforgivable mistake I made on Friday.
MACD and Stochastics down, and Friday’s rally just kissed DMA 3×3. That was one hell of a missed entry point I lost! Well, not exactly lack of attention: I was going to Rio with my parents to introduce them to the family of my fiancee. Stupid that I missed it, but not so much.
The lesson: you have a set of tools, pay attention to all of them. The more attention you pay to them, the more opportunities you’re going to find. Opportunities that allow you to get in a trade with confidence and make money. The big mistake I made was actually to give more priority to one of the aspects of my analysis and overlook others.
On the other hand, a missed opportunity is a missed opportunity: never look back and cry over it. Look ahead and find another one. And don’t miss it.


I really like your insight. It gives me a whole different point of view and keeps my focus on the big picture. However, I don’t like your title of this one; If you didn’t lose $$ then it is not an unforgivable mistake. You live to trade again!! Keep on posting.
Comment by akoptiontrader — October 6, 2008 @ 4:59 pm |
Ak, losing money is not a bad mistake if you have an edge. Lack of attention is worse. That was such a good obvious opportunity for a quick and easily manageable trade.
Comment by moontrader — October 6, 2008 @ 5:28 pm |
Understood, and I agree. I have had a few of those days myself. Glad to see you are ready to go again. Tomorrow could be another great day. AKOT
Comment by akoptiontrader — October 6, 2008 @ 5:48 pm |
I thought the low for the financial index today was the closing low of 7/15 i.e 295. In fact the financials rallied on hitting that level. Hence I hope the bottom has been tested. On your new low target of 920, what in your opinion is the path to get there from here- is it straight from here or does SPX get up to 1106+/- (last Mon low)and then work its way down? I can hear the humm of the Bernanke helicopter starting, and it is possible he is going to drop the bills soon!!
Comment by bullnbear87 — October 6, 2008 @ 6:39 pm |
Bullnbear, the path I don’t really know. But I believe it’s going to happen soon. We might have a rally above 1100 as you said. For me a point of reference is going to be DMA 3×3. On the other hand, if we go straight to 920 or so, then I might look for an entry point to go long.
Comment by moontrader — October 6, 2008 @ 7:19 pm |
I thought you had mentioned the 3 DMA sometimes over shoots like it in Sep, which caused you to go long and suggest “caution”, only to find it was an outlier. Also, at one point you wanted DMO to get below 1/22 lows, which it has done decisively today. But you still are not willing to call this a temp bottom – sort of spooks me. I closed all my shorts and want to go long but your 920 target is worrisome to me to get long. Even, Tim Knight has gone long on a day like today.
Comment by bullnbear87 — October 6, 2008 @ 7:41 pm |
CPC is at March and Lanuary lows

we might get September 19th type bounce soon?
Comment by Fork_Master_Serg — October 6, 2008 @ 7:53 pm |
Your mistake has cost me some real money. Perhaps next time, give a target date for the low with a plus and minus 5 day allowance.
Comment by katzo7 — October 6, 2008 @ 7:55 pm |
Moon:
Interesting post and..comments.
I am seeking some clarifications, just to be sure:
1. VIX: You write “Notice also that today’s close is the highest in the chart.” I don’t quite understand the “highest”. On highest is 60.63…also, it didn’t even close at today’s high. So, I am missing your point about the VIX, except that it is fairly high.
2. You mentioned missing your entry point on Friday – I get that. What I don’t get it is your comment for today that “However, I would still look for a better entry point”. Can you please expand this?
Thanks.
Comment by DalalStreetKing — October 6, 2008 @ 8:06 pm |
DalaStreetKing, Moon is pointing out the close on that VIX bar, the hatch horizontal mark, not the tops of the bars. It represents the “highest close” ever.
What I do not understand is the second spy chart, where the red arrow on the left bottom points to the DPO in 2000 and the above related price chart shows the spy subsequently falling a considerable amount after that red arrow marking and low in the DPO. If one extrapolates that info and applies it to today, where the DPO is in a similar position, the spy should fall from here in a similar pattern to 2000. Is that left red arrow positioned correctly on the chart? Or to be clear, are you saying the correction is not finished?
Comment by katzo7 — October 6, 2008 @ 8:31 pm |
First of all, let me just reply to Katzo’s first comment today. Don’t blame others for your own mistakes. I used to do that myself, years ago. I would plan a trade for days, waiting patiently for an entry point and then I would call my broker and place the order. He would then say: “Are you nuts?” or something like that. That would make me rethink, I would feel insecure because of his experience, and I would either cancel the order or revert it. Then the market would go according to my planned trade and I would lose money, plus get frustrated. You gotta have your own criteria, develop your own method. Reading blogs here and there are extremely useful because they give you a lot of insights, but you need to trade according to your own set of criteria. Blaming others is always easy. Instead, try to admit that the mistake is only yours, look back and find the reason you commit that mistake (instead of looking back to feel frustrated because you lost money), like I did in this post today. My mistake was to focus on one of my criteria and overlook the others. In other words, lack of attention. But remember, you’re the only one responsible for your trades. That’s important. Got it? Please, take this reply as a friendly one.
Comment by moontrader — October 6, 2008 @ 9:29 pm |
Moontrader, can you let me know when you post a lunar chart for the next low, ( time to go long)
I’m getting on my own analysis that 10 days or so, says the market will bottom for all of 2008.__
Can you see if any of your lunar charts, will support that time frame?
10 days or so, MARKET BOTTOM for all of 2008___
Comment by zee http://z-stock.blogspot.com/ — October 6, 2008 @ 9:35 pm |
Dalal, Katzo said it right: in the last 10 years, Vix never closed as high as today.
You second question: I’m just saying that I need to wait patiently for another opportunity, let’s say, for instance, if SPY goes up tomorrow, touches DMA 3×3 again, while MACD and Stochastics are still pointing down.
Comment by moontrader — October 6, 2008 @ 9:37 pm |
Katzo7, that was really a cheap shot. Maybe you should ask for ten times your subscription price back.
Comment by Tim Knight — October 6, 2008 @ 9:39 pm |
Bullnbear, you can say I’m a conservative trader. I’m always reminding people to be cautious, especially in a market like this. I can’t allow myself to stay too much time in a position, since I grow incredibly exhausted which can cause me to cover my positions just to feel relieved. So, I look for those points where I see a trade that has the potential to give me fast results. In a market like this, you can see opportunities all over. You just need to be ready to grab them. You’ll also miss opportunities. That’s fine. If you look back and understand why you missed it, then you have another tool in your toolbox. The more tools you have, the less opportunities you’ll miss.
Comment by moontrader — October 6, 2008 @ 9:49 pm |
I finally Found the mistake you made on FRIday. Why did you post that in the last chart?
I saw the same signal on Friday, and I didn’t know what to make of it.
That signal could have gone either way. I wouldn’t fret too much about that.
Just keep an equal amount of $$$ on longs and shorts, and play the swings for small gains. That’s what I’ve been doing, with 5% of the account.
The other 95% is on the sidelines, because I don’t invest in falling knives.
IN 10 days, market bottom, and a new bull rally in a bear market begins. Should last well past the elections.
Comment by zee http://z-stock.blogspot.com/ — October 6, 2008 @ 10:00 pm |
Zee
>IN 10 days, market bottom, and a new bull rally in a bear market begins
check Bradley model before you place any bets
Comment by Fork_Master_Serg — October 7, 2008 @ 12:00 am |
I guess, when you are looking for the SPX to get back to DMA 3×3 and get rejected by it, you are expecting to go short, assuming that the market may now get to 920. Is this correct assumption?
Comment by bullnbear87 — October 7, 2008 @ 5:17 am |